Running a gym involves more than just attracting new members and maintaining an equipped facility. You also have to analyze your financial performance, measure member retention, evaluate the efficiency of your classes and assess your customer acquisition costs.
The right KPIs can help you maximize revenues, analyze membership trends, and increase the efficiency of your operations. KPIs can help you gauge how effectively your business is running.
Simply collecting data is not enough, however. You also need to know which gym metrics are critical, how they are calculated, and the implications of the results on the overall performance of the business.
Regardless of whether you own an independent gym, CrossFit Box, yoga studio, or a big chain of gyms, this article will help you identify the critical gym KPIs, calculate them, and assess your performance against the industry benchmarks.
What Are Gym KPIs and Which Ones Matter The Most?
Gym KPIs include measurable indicators showing how well your fitness business is achieving its membership, sales, and operational goals. The most critical gym KPIs include those that measure customer growth and retention.
- Total social media followers do not necessarily indicate membership growth
- Website traffic does not automatically translate into paying customers
- Total lifetime registrations do not show how many members are currently active
- Revenue does not indicate profit
Gym owners should analyze five performance indicators:
- Memberships performance
- Revenue and finances
- Sales and customer acquisition
- Member engagement and facility utilization
- Operational efficiency
A good performance indicator should illustrate three aspects of a business: the status quo, the explanation for the status quo, and what the business should do next.
According to the Benchmarking Report for the 2025 Fitness Industry by The Health & Fitness Association, 175 businesses across 27 countries and more than 17,000 fitness centers reported median revenue growth of 9.9% for 2024. They also reported net membership growth of 5.5% and average member retention of 66.4% for 2024. Although these statistics show the growth and performance of the overall fitness industry, individual gyms should set their goals based on their business and membership models. (Source: HFA 2025 Benchmarking Report)
Which Membership KPIs Should Every Gym Track?
The most fundamental membership KPIs are active members, new members, cancellations, churn rate and retention rate.
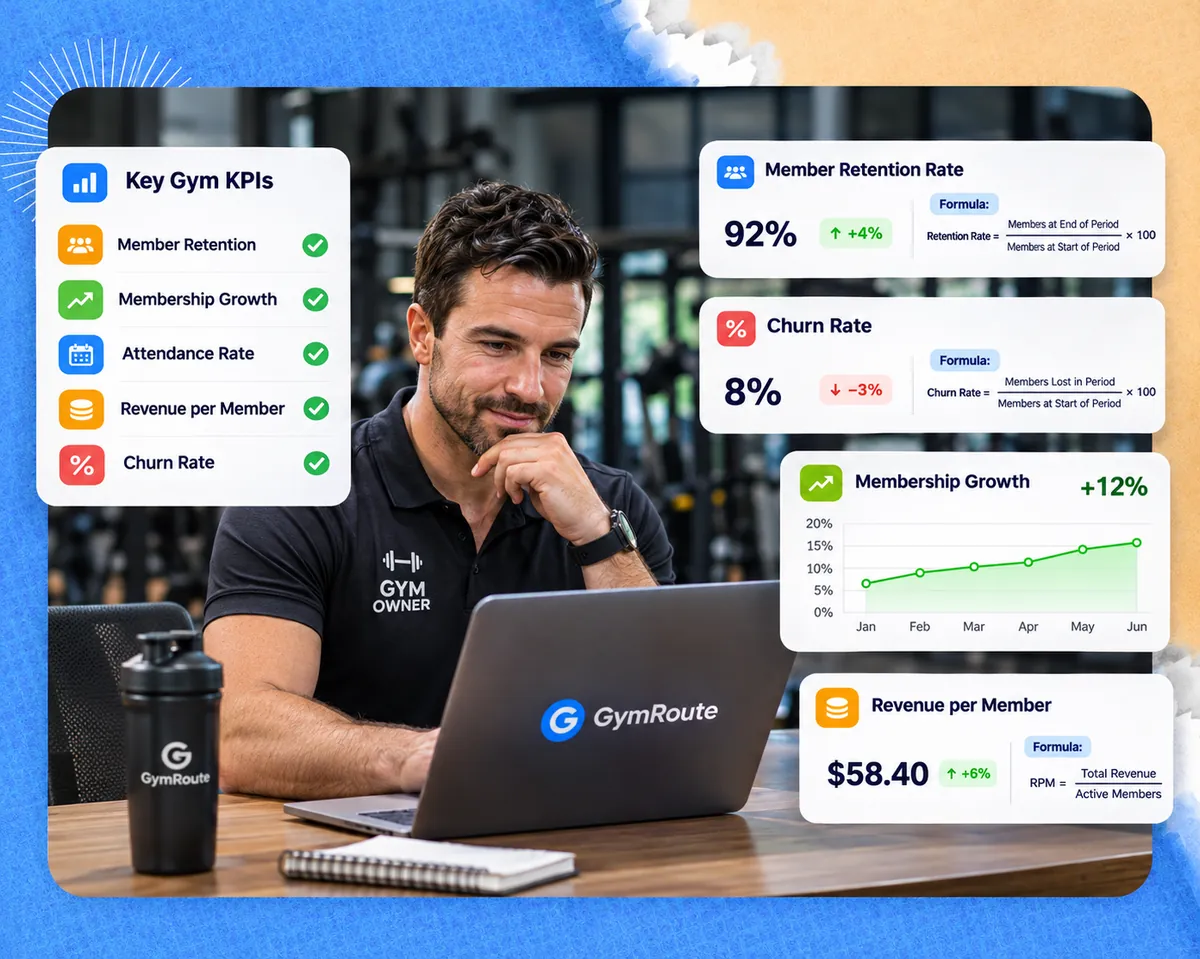
1. Active Members
Definition: Active members are memberships that are currently valid and being charged.
Formula: Active Members = Total Current Paying Memberships
Example: A gym has 350 registered customers. Of these, 280 have active paid memberships, 20 are on approved membership freezes, and 50 have canceled.
Active members = 280
Benchmark: Generally speaking, there are no predefined targets for an active membership number. Compare your result to previous months, evaluate your capacity, and determine if your membership sales are achieving your revenue objectives.
2. New Joins vs. Cancellations
Definition: This ratio compares the number of new members to the number of members who canceled in the same time period.
Formula: Net Member Growth = New Joins – Cancellations
Example:
- New Joins = 45
- Cancellations = 25
Net Member Growth = 45-25 = 20
The gym achieved a net member growth of 20 within the period.
Benchmark: It is generally agreed upon that it is ideal to have positive net membership growth. The HFA’s 2025 benchmarking report for 2024 showed the average net membership growth to be 5.5%.
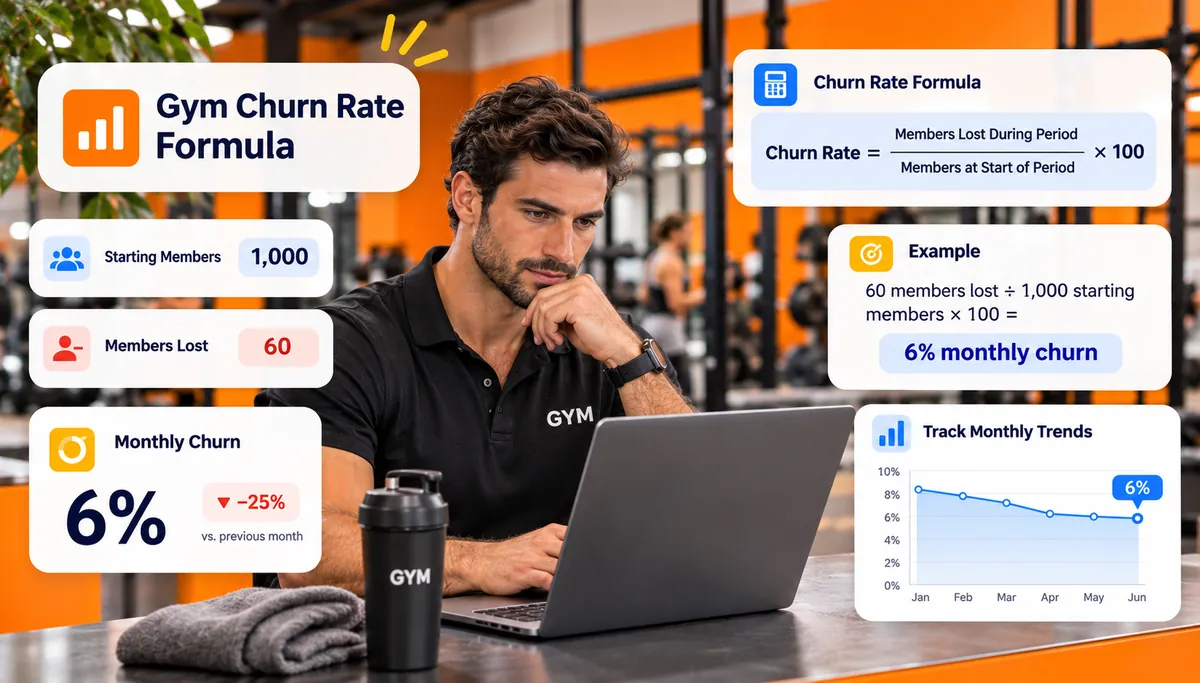
3. Gym Churn Rate Formula
Definition: The gym churn rate is the percentage of members who canceled during the month compared to the total members at the start of the month.
Formula: Monthly Churn Rate = (Members lost during the month ÷ Active members at the start of the month) x 100
Example:
At the beginning of the month, the gym had 300 active members and 18 members canceled their memberships.
Gym Churn Rate = (18 ÷ 300) x 100 = 6%
This means 6% of the members canceled their memberships during the month.
Benchmark: The HFA reported annual retention at 66.4% for 2024. This is an annual industry measure, not a monthly churn target. Gyms should compare their monthly churn to historical values and determine their annual retention by using the same membership group for the comparison. For a simplified example, a monthly churn rate of 6% would indicate about 47.6% annual retention (0.94 to the power of 12).
4. Member Retention Rate
Definition: Member retention rate shows what percentage of members remain active over a period.
Formula:
Member Retention Rate = (Members from starting cohort active at the end of the period ÷ Starting cohort members) × 100
Example:
A gym has 250 members at the start of the year. After 12 months, 170 of the original members remain active.
Member Retention Rate = (170 ÷ 250) × 100
Annual retention = 68%
Benchmark: HFA’s 2025 report showed an average member retention of 66.4% for 2024. Compare your results to this figure, accounting for differences in gym and membership type.
| Membership KPIs | Formula | Example result |
|---|---|---|
| Active members | Current paying memberships | 280 |
| Net member growth | New joins – cancellations | +20 |
| Monthly churn | Members lost ÷ starting members × 100 | 6% |
| Annual retention | Original cohort retained ÷ starting cohort × 100 | 68% |
Tracking these gym KPIs, in addition to sign-ups, helps owners gain insight into how well the business is operating.
Which Revenue KPIs Should Gym Owners Monitor?
Revenue KPIs help gym owners understand how much money the business generates, how efficiently memberships produce income, and how valuable each customer is over time.
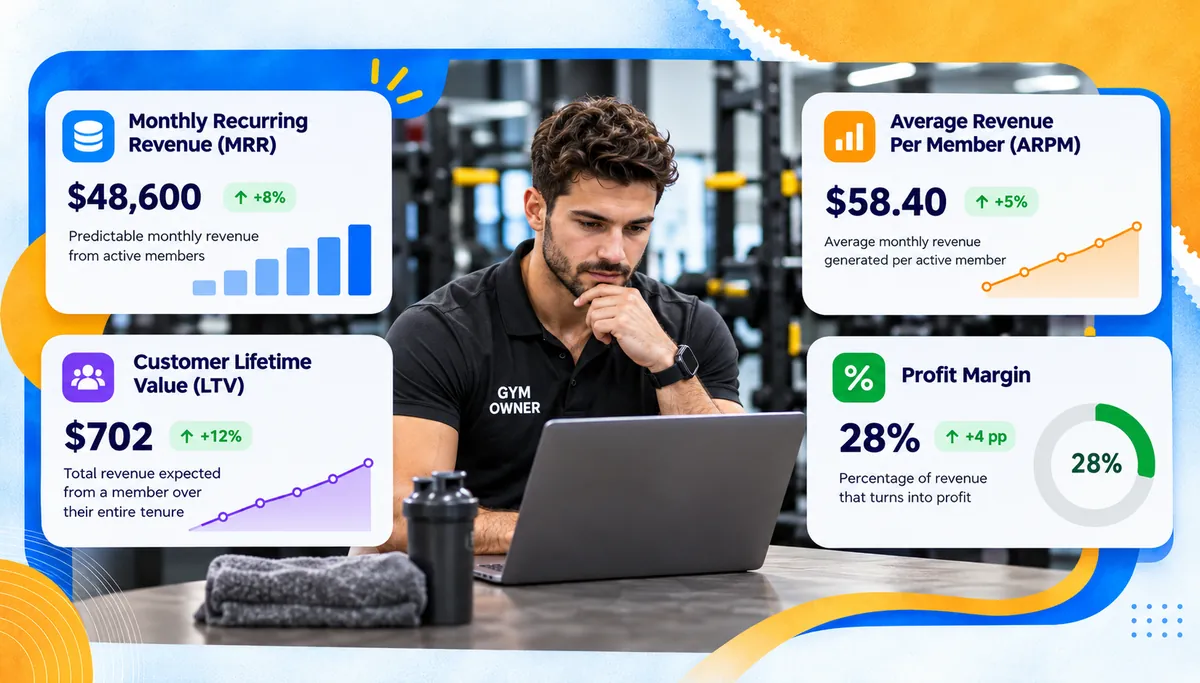
The most important financial gym metrics include monthly recurring revenue (MRR), average revenue per member (ARPM), member lifetime value (LTV), and profit margin.
1. Monthly Recurring Revenue (MRR)
Definition: MRR is a recurring revenue metric that measures the amount of revenue that is predictable each month.
Formula:
MRR = Total Active Recurring Membership Revenue Per Month
Example: A gym has:
- 100 members paying $50/month
- 80 members paying $75/month
- 20 members paying $100/month
- MRR = ($5,000 + $6,000 + $2,000)
Monthly recurring revenue = $13,000
Benchmark: There is no universal MRR target. Gym owners should track month-over-month growth, the amount of recurring revenue, and membership revenue as a percentage of revenue.
When calculating MRR, don’t include one-time joining fees and non-recurring purchases.
2. Average Revenue Per Member (ARPM)
Definition: Average revenue per member (ARPM): The revenue generated per member during a certain period.
Formula: The monthly membership revenue divided by the average number of active paying members.
Example: A fitness center has an average of 300 paying members and a membership revenue of $18,000 per month.
ARPM = $18,000 ÷ 300
The average member pays $60 per month.
Benchmark: There is no single ARPM benchmark for all gyms, because price tiers, family plans and class mix differ. Compare your ARPM month over month and against your own price list.
3. Member Lifetime Value (LTV)
Definition: Member lifetime value is the amount of money a gym can make from a member over the length of his/her membership.
Formula:
LTV = ARPM × Average Membership Lifespan (in months)
A very simplistic approximation of the life expectancy of a member is:
Average Membership Lifespan = 1/Monthly Churn Rate
Example:
- Average monthly revenue: $60
- Monthly churn rate: 5%.
- The number of months in the membership: 20 months.
- LTV = $60 × 20
Estimated member LTV = $1,200
Benchmark: No universal target for the LTV. Do a comparison of LTV, customer acquisition costs and customer contribution margin. Revenue-based LTV is not related to customer lifetime profit.
4. Profit Margin
Definition: The definition of profit margin is the amount of money that remains after subtracting the expenses relevant to the profit margin from the revenue.
Formula: Operating Profit Margin = (Operating Profit/Total Revenue) x 100
Example: A gym has $40,000 in monthly revenue and an $8,000 operating profit.
Profit Margin = ($8,000 ÷ $40,000) × 100
Operating profit margin = 20%
Benchmark: HFA’s 2025 benchmarking report indicated a median EBITDA margin of 23.6% for participating operators. EBITDA is NOT the same as operating profit margin, so do not view it as an exact target or interchangeable figure.
| Revenue KPI | Formula | Example |
|---|---|---|
| MRR | Recurring monthly membership revenue | $13,000 |
| ARPM | Membership revenue/average active members | $60 |
| LTV | ARPM × estimated membership lifespan | $1,200 |
| Operating profit margin | Operating profit ÷ revenue × 100 | 20% |
These revenue KPIs can be used by gyms to assess their pricing strategy, membership plans, and financial results. If you’re looking for more financial advice, check out our gym pricing and profitability guide.
Which Sales KPIs Matter?
Sales KPIs indicate the efficiency of how a gym turns its leads into paying members and the costs it incurs to gain the membership.
The three important measurements are cost per lead (CPL), lead conversion rate, and cost per acquisition (CPA).
1. Cost Per Lead (CPL)
Definition: CPL stands for cost per lead, which is the average that it takes to spend to get one qualified or recorded lead.
Formula: CPL = Marketing spend/Leads generated
Example: A gym spends $1200 on advertising for a month and receives 40 leads.
CPL = $1,200 ÷ 40
Cost per lead = $30
Benchmark: WordStream’s 2026 Google Ads benchmarks (campaigns running April 2025 to March 2026) put the median cost per lead for Health & Fitness at $67.36. This covers the wider fitness category, not only local gyms, so use it as a rough search-ads comparison and set your own baseline.
2. Lead Conversion Rate
Definition: The rate of conversion of leads to paying members is defined as the lead conversion rate.
Formula: Lead Conversion Rate = (New Paying Members ÷ Total Leads) × 100
Example: A gym receives 50 leads, and 10 of those leads become paying members.
Conversion Rate = (10 ÷ 50) × 100
Lead conversion rate = 20%
Benchmark: Inquiries from the web, referrals, walk-ins, trials, and paid ads all have different conversion rates. Do not go by industry-wide lead sources to set a baseline; use your own.
3. Cost Per Acquisition (CPA)
Definition: CPA is a measure of the cost of gaining one paying member for a gym.
Formula: CPA = Total Acquisition Spend ÷ New Paying Members Acquired
Example: A gym pays $1500 in marketing & acquisition costs and enrolls 15 paying members.
CPA = $1,500 ÷ 15
Cost per acquisition = $100
Benchmark: Compare CPA and member LTV to contribution margin. The $100 acquisition fee may be profitable for a $1200 revenue-generating member who is going to be around for years, but may not be profitable for a $100 member who is only in for a year.
When you combine the tracking of CPL with tracking of conversion rate and CPA, you will be able to tell if you have a problem with leads that are too expensive or a problem with a weak sales funnel.
Which Engagement and Operational Gym Metrics Should You Track?
Engagement and Operational Gym Metrics assess how well members utilize the facility, how effectively classes utilize the space and capacity, and how optimally the facility and equipment are utilized.
These help owners understand if their schedules, equipment, and facilities are utilized to their full potential.
1. Visit Frequency
Definition: Visit frequency is the average number of times a member utilizes the gym during a given period.
Formula: Visit Frequency = Total Member Check-ins ÷ Average Active Members
Example: During the week, a gym records 1,200 member check-ins and has 300 active members.
Visit Frequency = 1,200 ÷ 300
Average visit frequency = 4 visits per member per week
Benchmark: There is no ideal average for all gym types. Thus, compare your results with member visits and segment results based on member type.
2. Class Attendance and Capacity Utilization
Definition: Capacity utilization is the share of available class places that are filled by actual attendees.
Formula: Class Capacity Utilization = (Actual Class Attendance ÷ Total Available Class Capacity) × 100
Example: Suppose a fitness studio offers 20 spots per class, and the average class has 16 participants.
Capacity Utilization = (16 ÷ 20) × 100
Class capacity utilization = 80%
Benchmark: No industry-wide benchmarks exist for classes, so compare utilization by instructor or time slot.
Use actual class participants, not bookings, to determine class utilization. No-shows can make a class appear full when it is not.
3. Revenue Per Square Foot
Definition: Revenue per square foot shows how much revenue a gym generates per usable square foot of its facility.
Formula: Revenue Per Square Foot = Annual Gym Revenue ÷ Total Facility Square Footage
Example: If a fitness facility has 8,000 square feet of usable space and generates $480,000 in annual revenue,
Revenue per square foot = $480,000 ÷ 8,000
Revenue per square foot = $60
Benchmark: HFA includes revenue and occupancy cost per indoor square foot in their industry benchmarking report, and no single target exists for all gym formats. Compare facilities with similar sizes, locations and business models.
| Operational KPI | Formula | Example |
|---|---|---|
| Visit Frequency | Total member check-ins ÷ average active members | 4 visits per week |
| Class Utilization | Percentage of class attendees out of the total class capacity | 80% |
| Revenue per Square Foot | Annual revenue of the facility divided by the total area of the facility | $60 per square foot per year |
Track these three together with the membership and revenue KPIs on your dashboard (next section).
How to Build a Gym KPI Dashboard That Actually Helps Your Business?
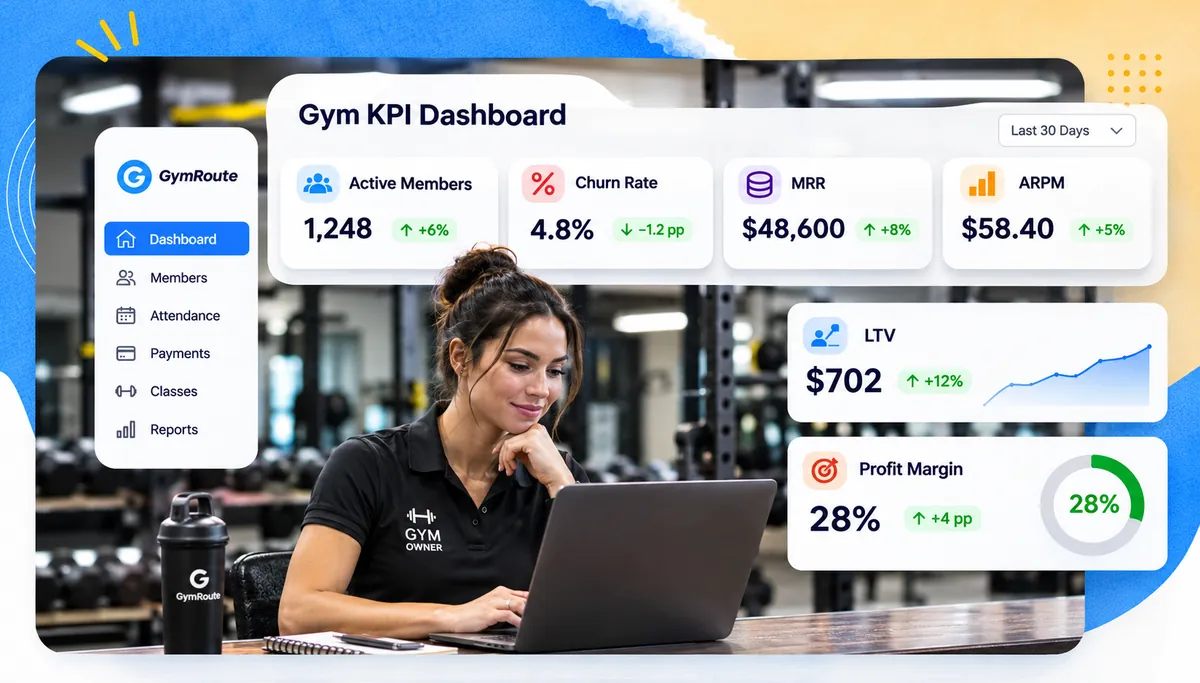
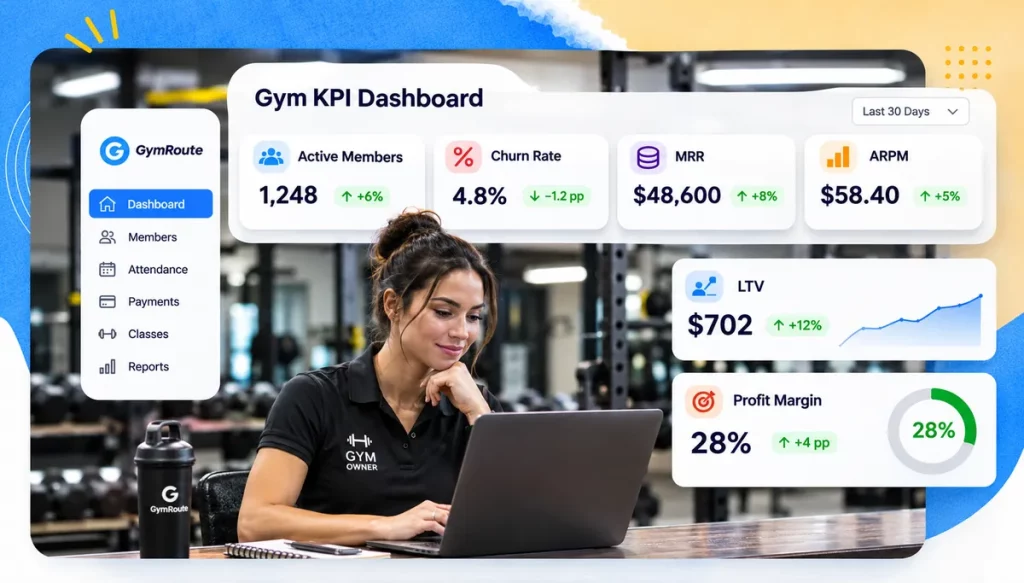
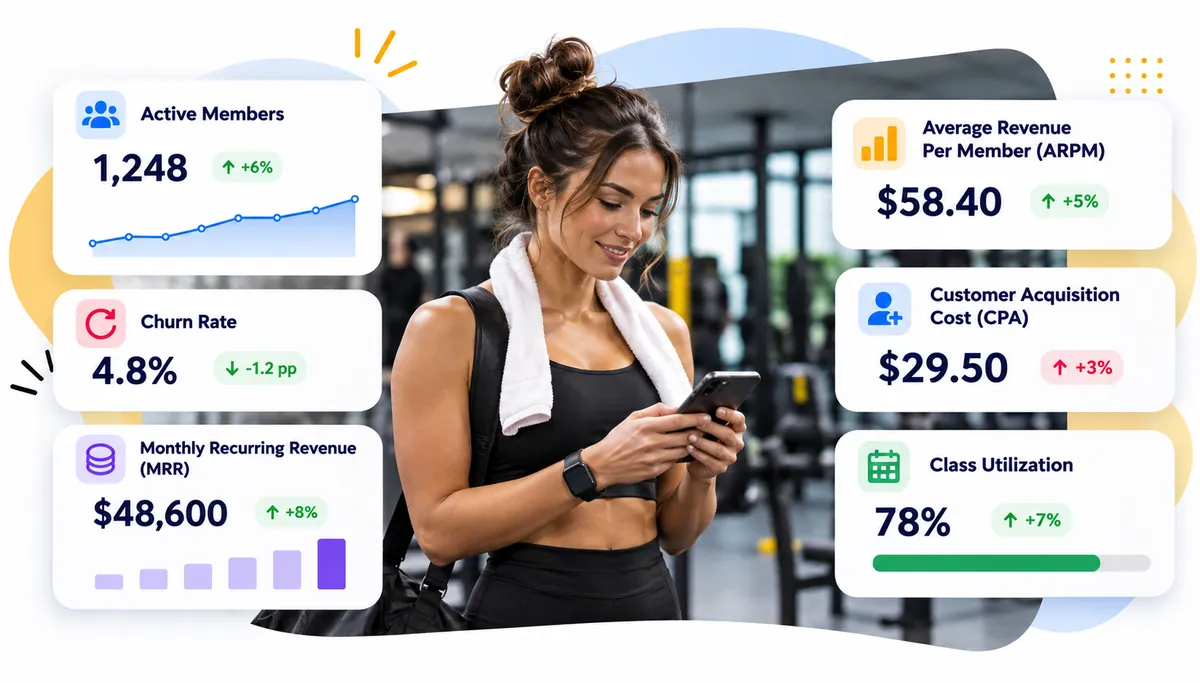
A gym KPI dashboard shows five or six core numbers in one view: active members, monthly churn, monthly recurring revenue, average revenue per member, cost per acquisition and class utilization. Gym owners can monitor these core indicators and drill down into the data as needed.
Here is the starter list:
- Active members
- Monthly churn
- Monthly recurring revenue
- Average revenue per member
- Cost per acquisition
- Class capacity utilization
Each KPI should be tracked by its value, previous period’s value, target and status.
| KPI | Current result | Target | Status |
|---|---|---|---|
| Active members | 320 | 350 | Below target |
| Monthly churn | 6% | 4% | Needs attention |
| MRR | $19,200 | $20,000 | Near target |
| ARPM | $60 | $65 | Below target |
| CPA | $100 | $120 max | Within target |
| Class utilization | 80% | 85% | Near target |
These goals are examples of business goals and are not necessarily industry standards. An effective dashboard allows owners to view information based on location, membership type, class, instructor and reporting period.
Consider membership management software to see how centralized membership information can improve consistent business reporting.
How Often Should Gym Owners Review Their KPIs?
Gym owners should look at different KPIs at different intervals. Payment issues require immediate attention. Attendance is worth a daily glance, while retention and churn trends show up over weeks and months. Long-term financial performance should be monitored quarterly.
A good reporting schedule is structured and balanced to prevent important trends from going unnoticed.
| Review | KPIs | Purpose |
|---|---|---|
| Daily | Payments, collections, overdue accounts, attendance, bookings | Identify operational issues |
| Weekly | New joins, cancellations, leads, conversions, attendance, retention | Identify trends |
| Monthly | Churn, MRR, ARPM, CPA, profitability | Assess business performance |
| Quarterly | LTV, revenue per sq.ft, membership growth, profitability | Assess business performance & strategic direction |
A weekly report can help identify members whose attendance has dropped well below their usual pattern, for example from three visits a week to one, to give staff a reason to investigate. GymRoute’s attendance alerts help staff spot these drops early.
This is an early warning indicator, NOT a certain cancellation indicator. Consider scheduled time off, scheduled work stoppage (freezes), and planned changes to scheduled work before moving a member to the “at risk” category.
GymRoute’s centralized membership and operational records allow staff to easily review member activity to determine if a member is requiring additional attention.
What Are the Most Common Gym KPI Tracking Mistakes?
The most common gym KPI mistakes are tracking vanity metrics, tracking too many numbers, using no benchmarks, and not acting on the results.
- Tracking vanity metrics: Tracking website visits and social media followers doesn’t help with business growth. Focus on actual paying members, revenue, retention, and acquisition costs.
- Inconsistent formulas: Calculating member churn over different months by starting and ending memberships creates a false sense of comparison.
- Ignoring benchmarks: A number has no meaning without context. Compare results to previous performance or relevant competitors.
- Profit and revenue confusion: Just because membership revenue is up doesn’t mean the gym is operating profitably.
- Ignoring attendance patterns: Members often stop coming before they cancel, so check attendance weekly.
- Tracking too many KPIs: Start with a core six KPIs, and add more only when necessary.
- Inaction: A dashboard is only beneficial when changes are made based on results.
For ways to keep members, see these member incentive ideas and our member onboarding guide.
How Can GymRoute Help Gym Owners Track and Manage Business KPIs?
GymRoute allows fitness businesses to organize operational information to help track and manage members, payments and attendance.
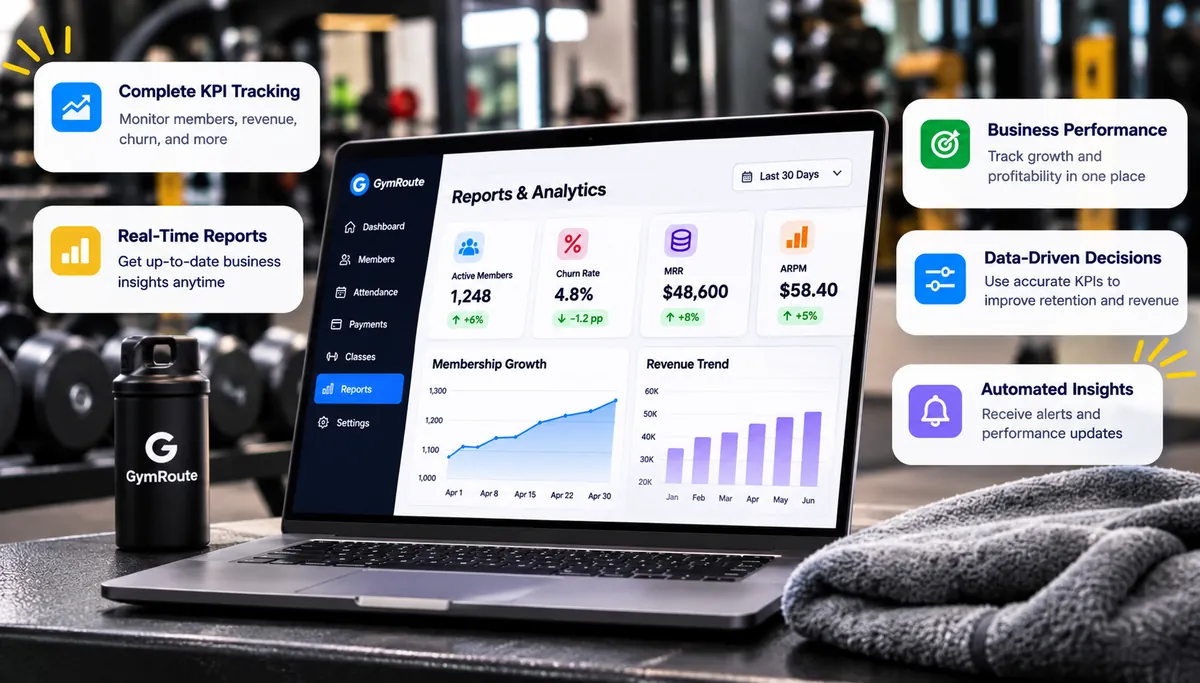
As the number of members at a gym grows, manually reporting on KPIs becomes nearly impossible. Staff have to compile information from multiple sources, including spreadsheets, payment records, booking records, and other reporting tools just to understand the basic performance of the gym.
GymRoute consolidates essential gym management tools to reduce the need for manual administration and allow gym owners to access their business information in a clearer, easier-to-understand format.
It includes:
- Management of members and packages: Create member profiles, manage member packages, and record member payment status and history.
- Billing and autopay: Manage customer invoices, payment reminders, and overdue accounts.
- Attendance: Track member check-ins and attendance.
- Classes: Manage bookings for classes and resources.
- Leads: Manage sales leads (Exceed plan and above).
- Reports: Generate management and financial reports.
- Locations: Manage multiple fitness centers (Ultimate plan).
GymRoute is also integrated with payment providers like Stripe, GoCardless, and PayTabs, enabling businesses to deal with recurring payment operations.
Centralized membership management can offer gym owners a more uniform platform for managing and reporting on business performance when it comes to moving beyond disconnected spreadsheets.
The goal is not just to get more gym KPI’s. Its purpose is to simplify the numbers for easier operation and use in decision-making.
Looking to get a better understanding of how your gym is doing? Visit www.gymroute.com and request a demo to find out how GymRoute’s gym management features can help you with reporting and day-to-day operations.
Frequently Asked Questions (FAQs) About Gym KPIs
What are the most important gym KPIs?
Gym key performance indicators (KPIs) to consider are active members, monthly churn rate, retention rate, monthly recurring revenue, average revenue per member, cost per acquisition, class utilization, and member visit frequency.
What is the formula to calculate the gym churn rate?
Find the percentage of membership lost by dividing the number of individuals who canceled in a given month by the membership at the start of the month, and multiplying by 100. For instance, if there are 300 members who started their membership and 15 of them cancel within a month, the churn rate is 5%.
What is a good gym retention rate?
The average annual member retention for 2024 is 66.4%, according to HFA’s 2025 Fitness Industry Benchmarking Report. But the retention rates are dependent on the gym format, pricing and membership model. Owners should make comparisons with other similar facilities.
How can you calculate the average revenue per member?
Calculate the ratio of the total monthly revenue from memberships to the average number of active paying members during the month. For instance, if a company brings in $15,000 in membership revenues and has 250 members, the ARPM would be $60.
What is the difference between ARPM and LTV?
ARPM is the average revenue each member pays in a set period, usually a month. LTV is the total revenue a member brings in over their whole membership, estimated as ARPM multiplied by average membership length in months.
What is the cost per lead for a gym?
Divide total marketing expenditure by the number of leads generated. For example, if a gym spends $1,000 and generates 25 leads, its CPL is $40.
What should a gym KPI dashboard include?
The metrics you can add to a gym KPI dashboard are active members, new joins, cancellations, churn, MRR, ARPM, CPA, gym attendance and class utilization. It is practical to begin with 6 basic KPIs in the case of most independent facilities.
When should gym owners check on KPIs?
Check payments and attendance daily, new joins, cancellations and leads weekly, churn, MRR, ARPM and CPA monthly, and LTV and long-term profitability quarterly.
Is it possible to automatically track KPIs with gym management software?
Yes. GymRoute is an example of a gym management platform that can store membership details, recurring payments, payment status, and gym activity in one central place, eliminating the need to manually gather this information. Specific calculations and automated reports are available depending on the reporting capabilities of the platform.
Why are gym KPIs important for profitability?
Gym KPIs enable the owners to comprehend revenue, acquisition costs, membership retention, facility utilization, and operating expenses. These measurements can be monitored to easily recognize financial issues and assess business decisions based on real performance.